Sampling-Based NDV Estimation in Iceberg Tables
NDV (number of distinct values) is one of the most important statistics in cost-based query optimization. It affects selectivity estimates, join ordering, and intermediate cardinality predictions, so bad NDV estimates can quickly cascade into poor plans.
The problem is that NDV is hard to estimate under strict latency constraints. In Floecat, synchronous statistics capture has roughly one second to inspect an Iceberg table, sample a subset of Parquet row groups, and return something useful to the planner. That means the system must make decisions from partial and sometimes unrepresentative data.
This post looks at how NDV behaves under that kind of sampling pressure. Rather than trusting a single estimator, Floecat evaluates multiple estimators over the same sampled data, compares their behavior, and selects the most plausible result while tracking confidence. The goal is not perfect accuracy on the first pass, but a fast estimate that is useful immediately and can be refined asynchronously as more evidence becomes available.
I presented an earlier version of this work to Andy Pavlo’s CMU Database Group; if you want additional context, a recording of that session is available.
Constraints of NDV Estimation Under Sampling
NDV estimation is fundamentally constrained by incomplete information. The system rarely scans an entire table during synchronous capture, and instead operates over a subset of Parquet row groups selected through a sampling policy. The reliability of any estimate depends on how representative that sample is, how values are distributed within it, and how quickly new distinct values are discovered as sampling progresses.
Within the synchronous capture window, the system must:
- select row groups
- perform remote reads
- decode Parquet data
- update estimator state
- compare candidate estimates
- return a result
This forces a trade-off between coverage and latency. Rather than attempting to converge fully, the system aims to produce a directionally useful estimate and explicitly communicate uncertainty.
Multi-Estimator NDV Framework
For each synchronous request, multiple NDV estimates are generated from the same sampled data. These estimates are treated as candidates rather than final answers. The system evaluates them collectively, discards those that are inconsistent with the sampled evidence or with other estimators, and returns a selected NDV derived from the remaining plausible estimates.
Estimator selection is driven by consistency and confidence scoring. Estimates that diverge significantly from others or violate observed sampling behavior are rejected. The remaining candidates are compared to produce a recommended NDV value. The returned NDV is therefore not tied to a single estimator. It represents a synthesis of multiple approaches applied to the same evidence.
Each estimate is annotated with confidence. High confidence indicates agreement between estimators and sufficient sampling coverage. Medium confidence reflects partial agreement. Low confidence indicates either insufficient sampling or estimator disagreement. If the evidence is too weak, the system may decline to return an NDV rather than provide a misleading value.
Estimator Family
The estimator family consists of three approaches, each suited to a different regime:
- Linear extrapolation is used for high-cardinality columns where discovery remains unsaturated. It scales observed distinct values according to sampling fraction. This performs well when duplicates are rare but can overestimate under clustering.
- Frequency-of-frequencies is used for medium-cardinality columns. It analyzes repetition patterns within the sample to estimate unseen values. It performs well when duplicates are present but becomes unstable when most sampled values are unique.
- Discovery-curve analysis is used for low-cardinality columns. It tracks the rate at which new values are discovered and detects convergence when that rate slows.
Estimator selection is therefore driven by observed behavior rather than pre-declared assumptions about the column.
Sampling Strategies
NDV estimation is driven by Parquet row-group sampling. This is embarrassingly parallel and maps naturally to distributed execution. Two sampling strategies are used:
- Random sampling selects row groups uniformly and provides unbiased estimates. This works well for statistical estimators but may require larger samples to stabilize.
- Metadata-guided sampling selects row groups based on min/max metadata to increase domain coverage. This improves early discovery for high-cardinality columns but can introduce bias when data is clustered or sorted.
The system records sampling diagnostics, including coverage and discovery behavior, and uses these signals when evaluating estimator stability.
Discovery Curve Interpretation
The discovery curve is a primary signal for estimator selection. It tracks how many new distinct values are observed as sampling increases. Three regimes emerge:
- Plateau regime: discovery stabilizes quickly. This indicates low cardinality, and the observed value is effectively exact.
- Decelerating regime: discovery slows over time. This indicates moderate cardinality, and frequency-of-frequencies estimation is preferred.
- Linear regime: discovery continues at a constant rate. This indicates high cardinality or insufficient sampling. Linear extrapolation is used, but with reduced confidence.
The estimator is effectively answering a simple question: are we finished discovering values, slowing down, or still discovering them at a constant rate.
Empirical Behavior
Datasets
The evaluation uses two datasets with different characteristics:
- TPC-DS SF1000 (2.8B rows, retail benchmark workload)
- NYC Taxi (~1.3B rows, real-world transactional + geographic data)
These datasets were chosen to expose different NDV regimes: low-cardinality identifiers, medium-cardinality dimensions, and high-cardinality keys.
The core experiments were run on an AWS i8g.4xlarge node (16 vCPUs, 128 GB DRAM) with the Iceberg tables stored in Amazon S3. These single-node measurements are used to characterize estimator behavior and execution cost; meeting the planner’s tighter latency budget depends on distributing row-group sampling across the execution layer.
TPC-DS SF1000
On the store_sales table (2.8B rows), the estimator exhibits three distinct behaviors. Low-cardinality columns such as ss_sold_date_sk converge almost immediately. Medium-cardinality columns such as ss_customer_sk stabilize within approximately 10-15 percent error under frequency-of-frequencies. High-cardinality columns such as ss_ticket_number remain unsaturated much longer and eventually transition into a linear extrapolation regime.
The behavior for ss_ticket_number is shown below. The discovery curve remains effectively linear through early sampling, which drives the estimator toward linear extrapolation.
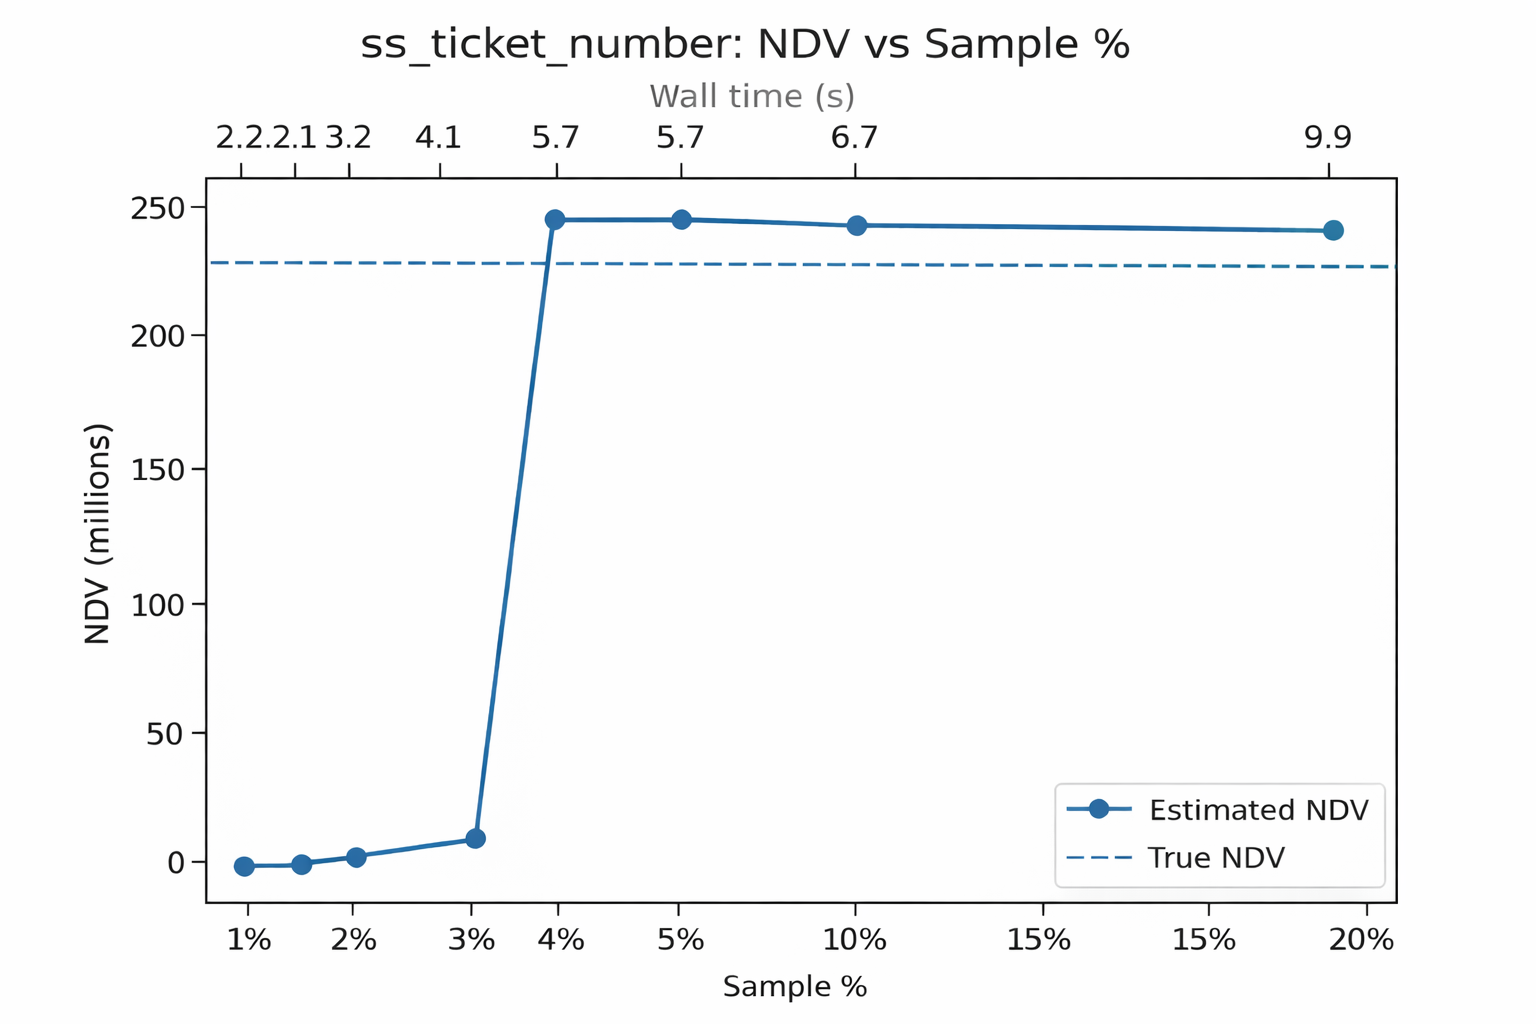
At low sampling fractions, the frequency-of-frequencies estimator underestimates NDV due to limited duplication evidence, before the system transitions to linear extrapolation once the discovery curve remains unsaturated.
For comparison, the behavior of a low-cardinality column such as ss_sold_date_sk is shown below.
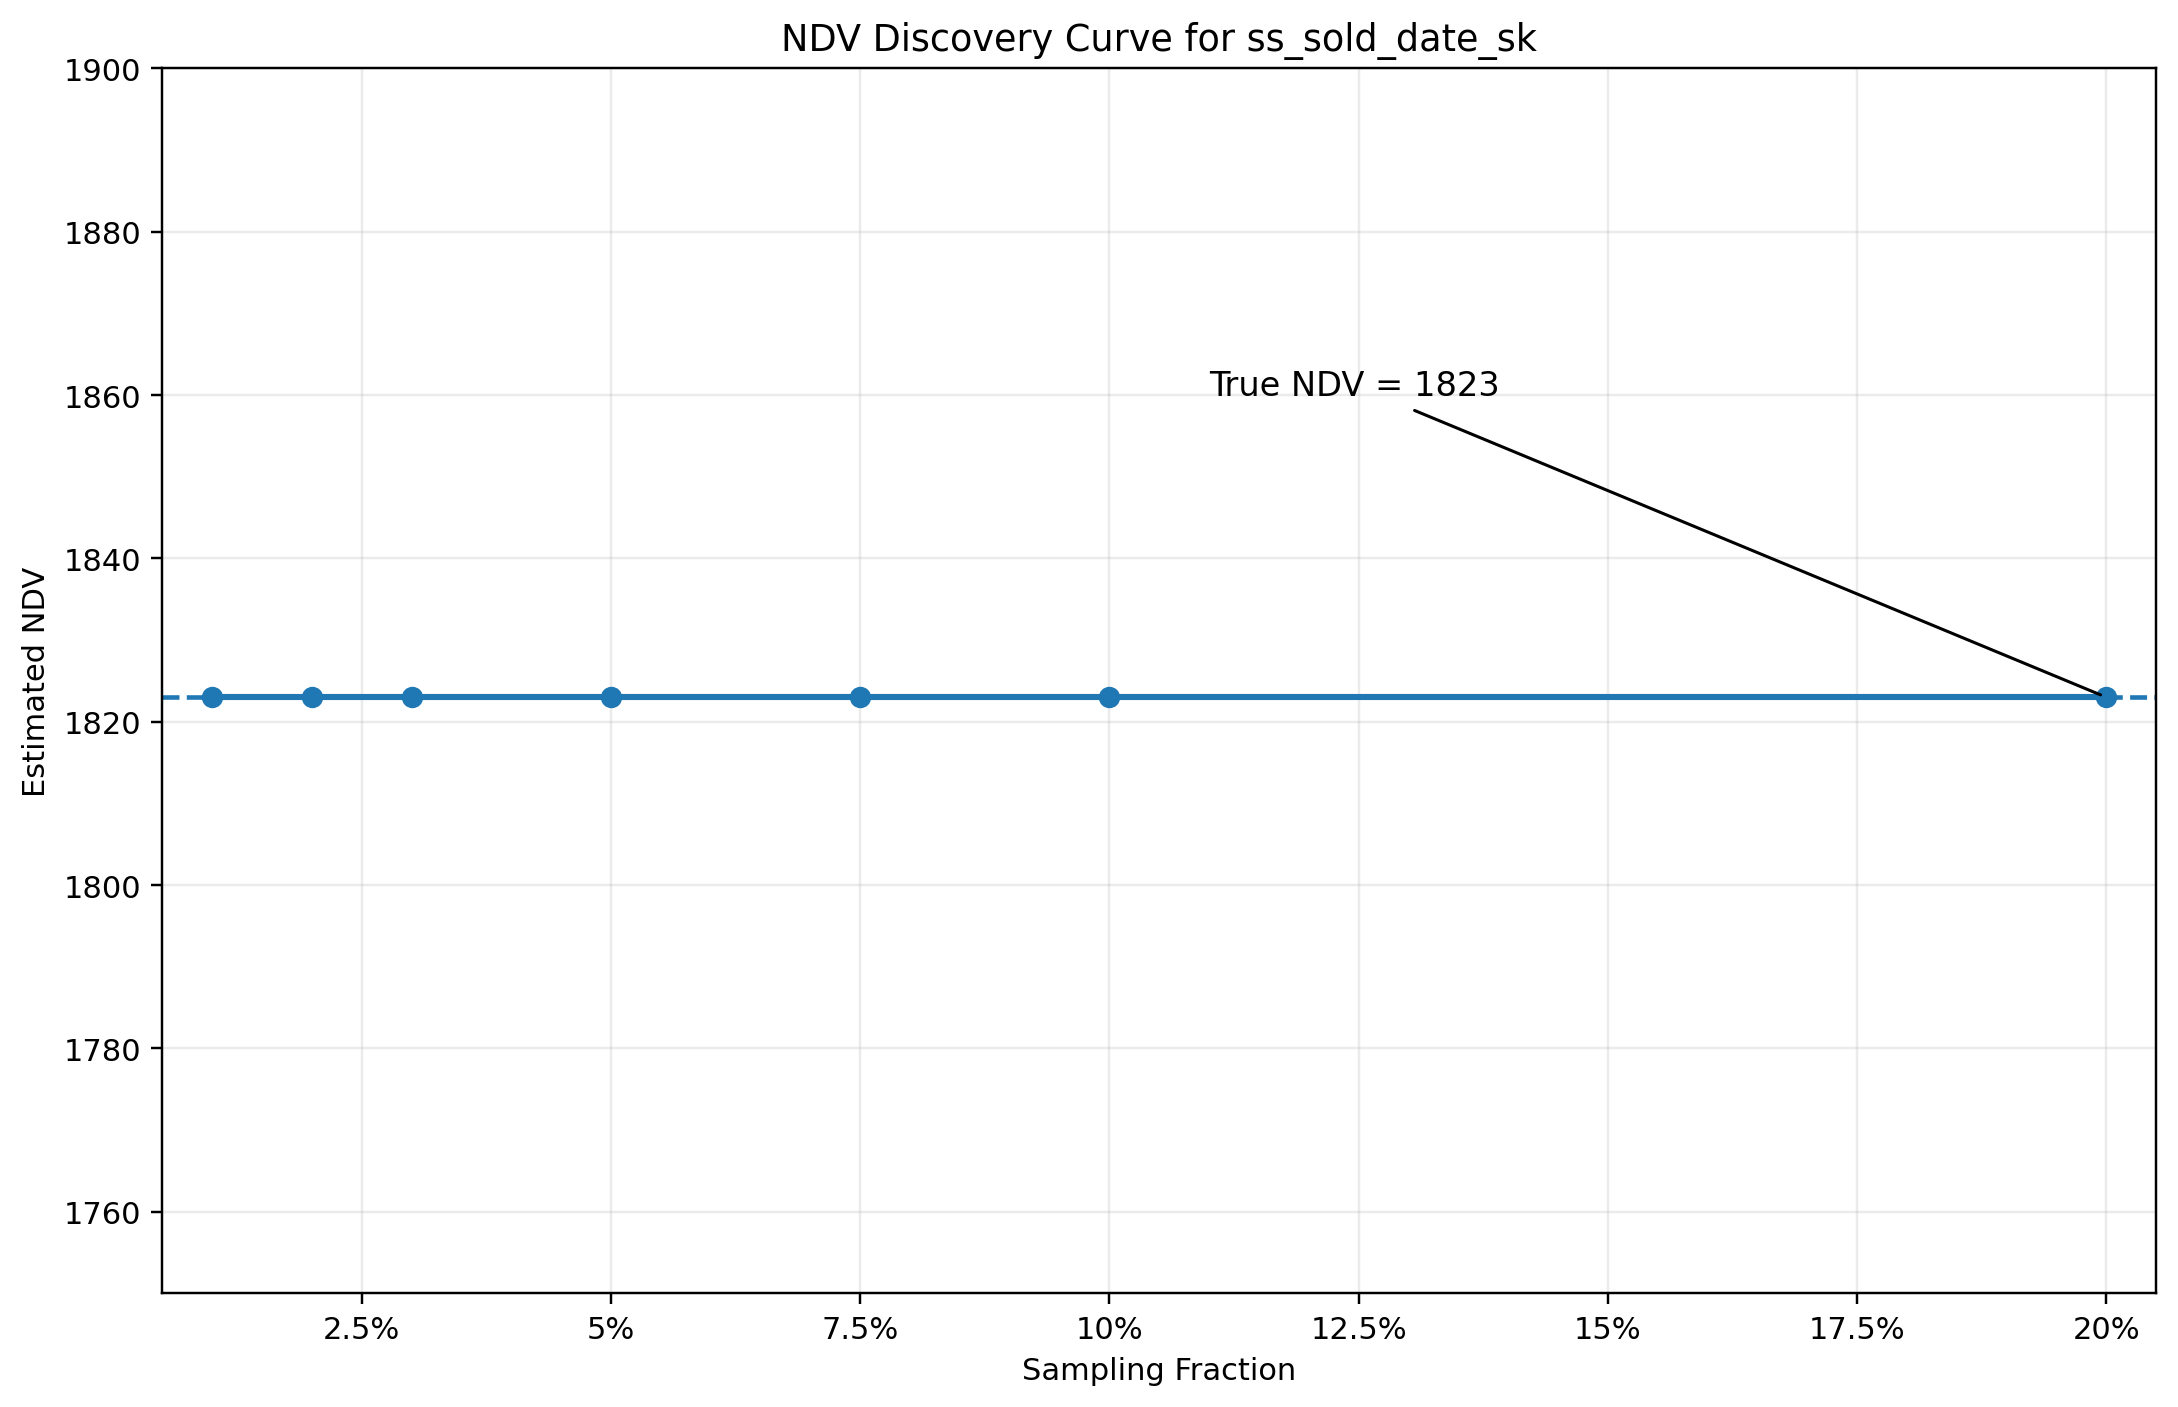
In contrast to ss_ticket_number, the discovery curve for ss_sold_date_sk saturates almost immediately. The number of distinct values stabilizes after scanning a small fraction of the table, and additional sampling does not materially increase the observed NDV.
This is the plateau regime. Once the system observes that discovery has effectively stopped, the observed NDV can be treated as complete with high confidence. There is no need for extrapolation or frequency-based estimation because the sample has already covered the domain of the column.
This behavior is typical for low-cardinality dimensions, particularly those with bounded domains such as dates, enumerations, or status codes. It also highlights an important property of the estimator framework: the system is not attempting to apply a single method universally, but instead switches behavior based on the observed shape of the discovery curve.
The contrast with ss_ticket_number is deliberate. In that case, discovery remains effectively linear and forces the system into an extrapolation regime with lower confidence. Here, discovery terminates early, allowing the system to return an exact result with minimal sampling effort.
NYC Taxi Dataset
The previous examples show idealized behavior under sampling. In practice, sampling can produce misleading signals when data is clustered or when row-group coverage is poor. The behavior of pickup_location_id from the NYC Taxi dataset illustrates this.
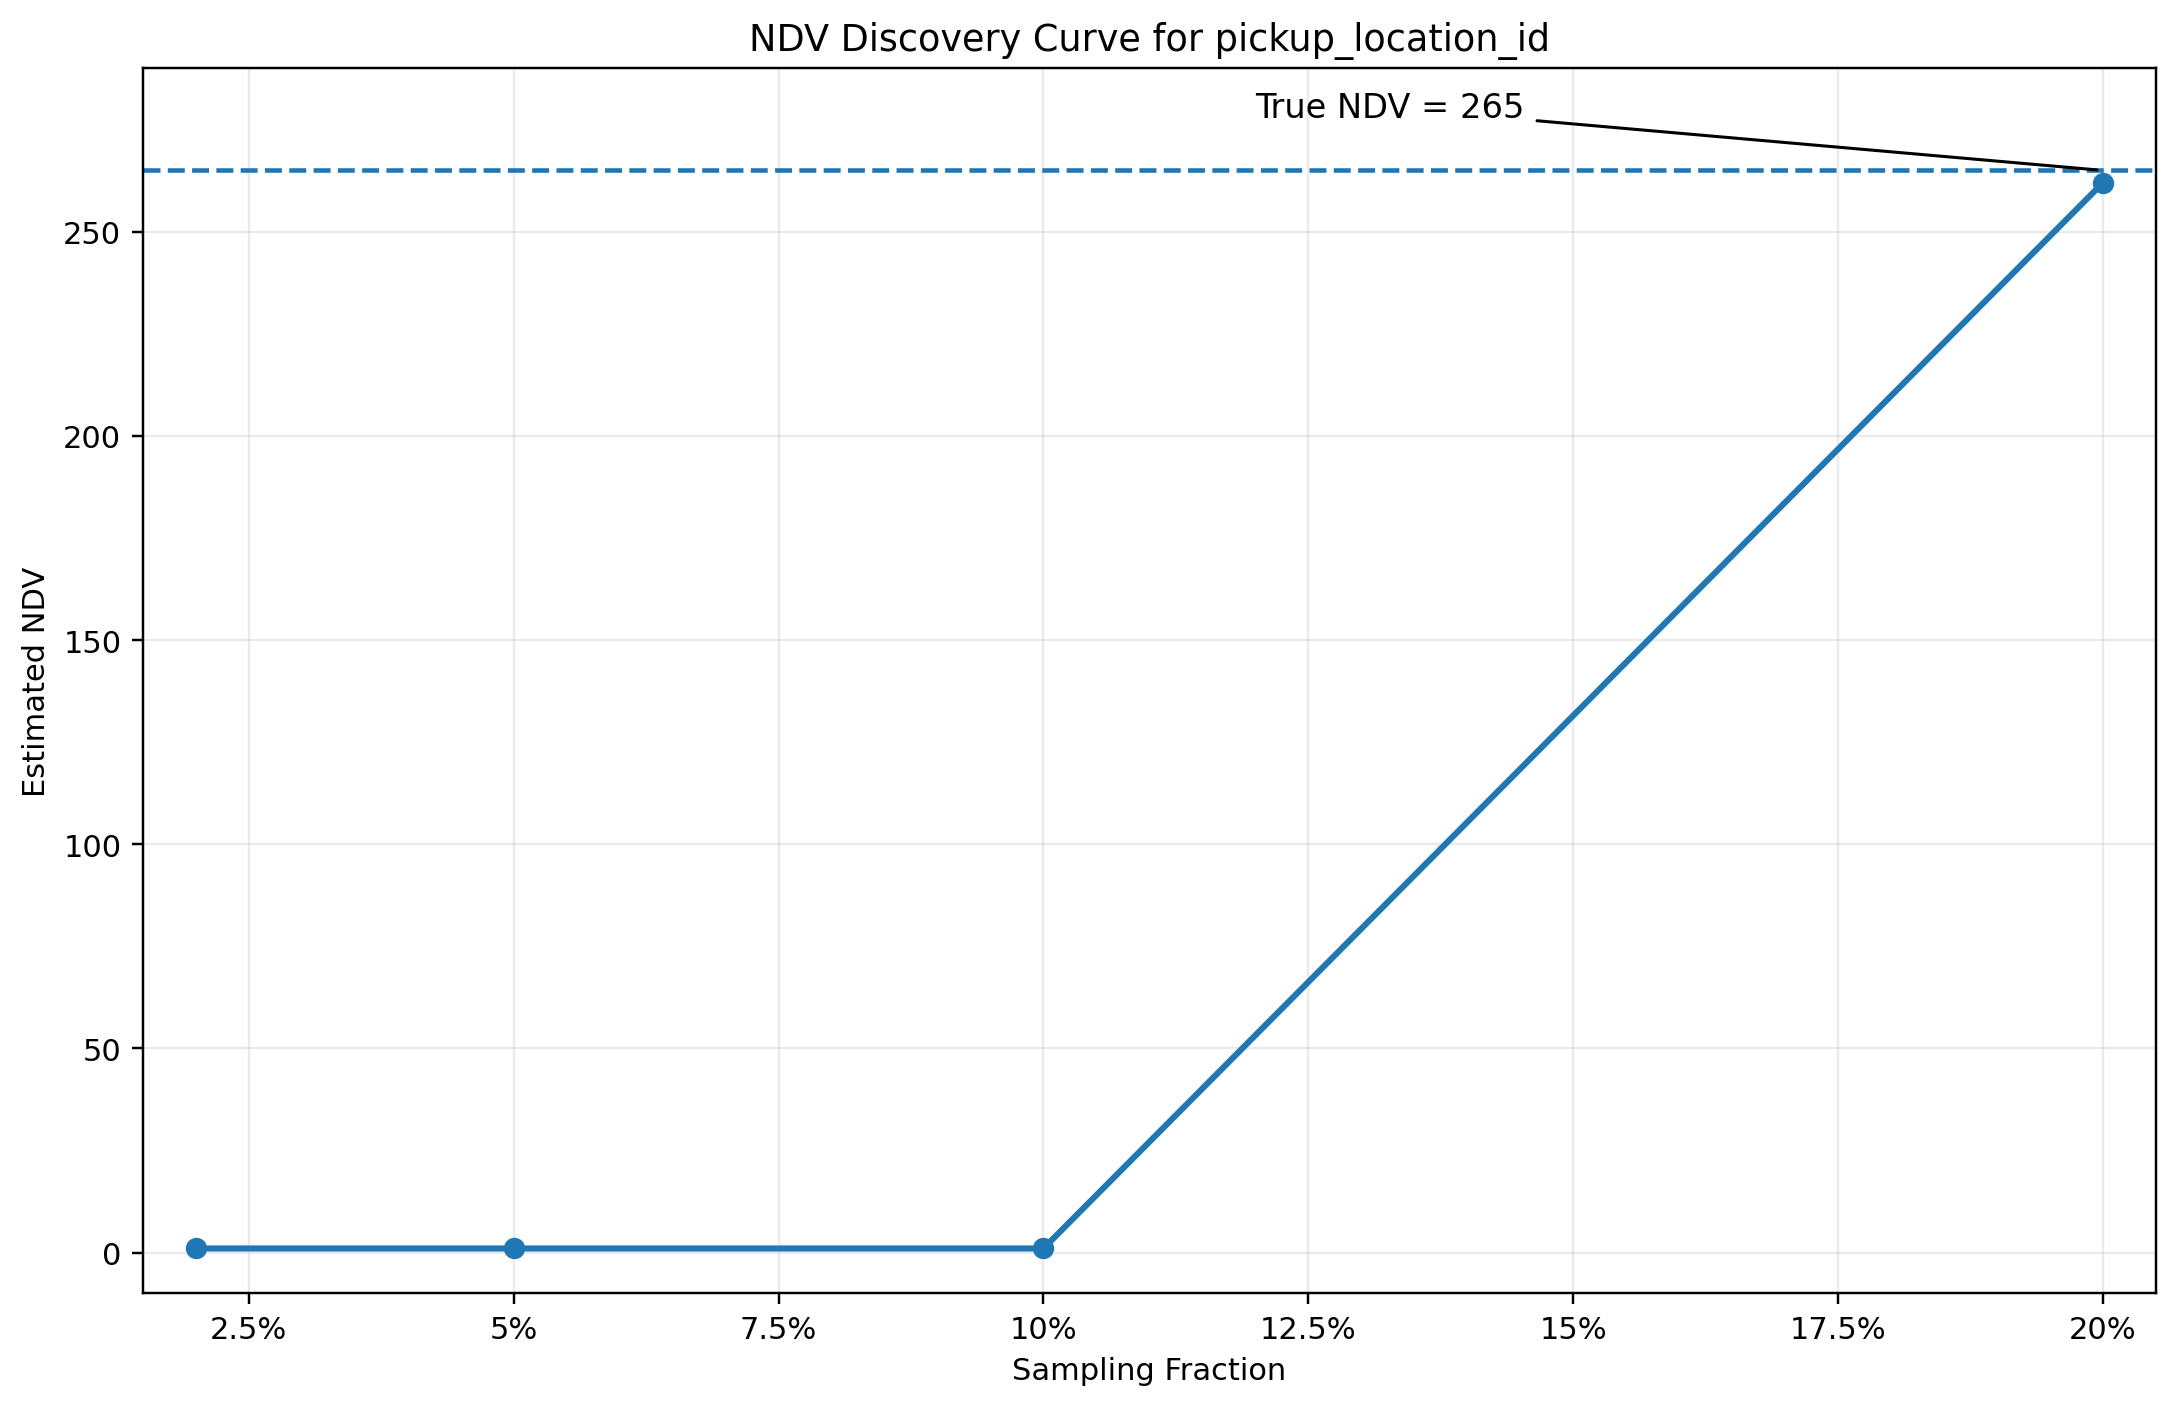
At low sampling fractions, the estimator incorrectly concludes that the column has a single distinct value. This is not a statistical failure of the estimator itself, but a consequence of the sampled row groups lacking diversity. The discovery curve appears to plateau immediately, even though the true NDV is 265.
As additional row groups are sampled, the estimate corrects abruptly, jumping from 1 to approximately the true value once sufficient domain coverage is achieved. This transition reflects the underlying data layout rather than a smooth convergence process.
This is a failure mode of sampling rather than estimation. In particular, metadata-guided or locality-biased sampling can amplify this effect when data is clustered. Early samples can appear stable while being fundamentally unrepresentative of the data. The estimator framework relies on diagnostics and confidence scoring to identify these cases, and asynchronous reconciliation ensures that incorrect early estimates are corrected over time.
This example highlights why NDV estimation cannot rely on a single method or a single sample. The system must be able to detect when the observed discovery curve is misleading and treat early results with appropriate caution.
The One-Second Problem
The defining constraint for this system is that statistics must be available within the planning window. On the AWS i8g.4xlarge baseline, 5 percent sampling produces approximately 9 percent error in roughly 4 seconds. Those single-node results establish that the estimator pipeline is efficient enough to be viable; production fits within the stricter planner budget by distributing row-group sampling horizontally across workers.
This is what makes the approach viable. The system is not trying to compute perfect statistics. It is trying to compute good enough statistics fast enough to influence planning.
What’s Still Hard
Several challenges remain, and they are structural rather than implementation details.
Statistical correctness under bounded latency is not solved. Sampling introduces bias when data is clustered, sorted, or unevenly distributed across row groups. Estimators can disagree significantly under skewed distributions, and while confidence scoring helps identify these cases, it does not provide guarantees. Without full scans, unbiased NDV estimation cannot be assumed.
Error bounds under sampling are also unresolved. In practice, the system produces estimates that are directionally useful, but there is no strict guarantee on worst-case error. Providing meaningful, data-dependent error bounds without increasing latency remains an open problem.
The interaction between sampling strategy and data layout is another source of instability. As shown in the NYC Taxi example, early samples can appear stable while being completely unrepresentative of the underlying data. Detecting these cases reliably, and adapting sampling strategy in response, is still an active area of work.
Extending the approach beyond single-column NDV is significantly harder. Multivariate statistics such as joint distributions, correlations, and functional dependencies do not decompose cleanly under sampling. These are often more important for planning than NDV itself, but are also more sensitive to incomplete data.
Finally, consistency across datasets depends on factors outside the control of the system. Without controlling how data is written, including ordering, partitioning, and clustering, the estimator must operate under arbitrary layouts. Designing statistics that are robust to these variations without requiring changes to the write path remains an open challenge.
Next Steps and Closing Observations
There are a few clear directions for improving this system.
Adaptive sampling is one area of focus. Rather than selecting row groups uniformly or based solely on metadata, the system can adjust sampling dynamically based on observed discovery behavior, increasing coverage in regions where estimates appear unstable.
Another direction is estimator refinement. Combining estimators is effective, but the selection logic can be improved by incorporating more explicit models of sampling bias and convergence behavior.
Finally, asynchronous refinement can be used more aggressively. Synchronous estimates provide a starting point for planning, but deeper scans can incrementally improve statistics over time, allowing the system to converge toward higher accuracy without impacting query latency.
The goal is not to eliminate uncertainty, but to manage it explicitly and reduce it where it matters most for planning.
NDV estimation under sampling is fundamentally about interpreting incomplete evidence under time constraints. Different estimators perform well under different regimes, and the system must adapt dynamically based on observed behavior.
The combination of sampling, multi-estimator evaluation, and confidence scoring allows the system to produce useful planner statistics within strict latency budgets. Asynchronous reconciliation then improves those estimates over time, allowing the system to balance responsiveness and accuracy without blocking query execution.
Engineering Appendix: Rust vs Java
The NDV estimation pipeline was implemented in both Rust and Java to evaluate which execution model is better suited to sampling-based statistics capture under strict latency constraints. The goal was to make a language and runtime choice for the production system based on measured performance.
These experiments were run on an AWS i8g.4xlarge node (16 vCPUs, 128 GB DRAM) with the Iceberg tables stored in Amazon S3.
Both implementations follow the same logical pipeline: snapshot resolution, file enumeration, row-group sampling, and NDV sketch computation.
The Java implementation uses a Parquet-native scan path with column readers and record iteration. It relies on Apache DataSketches for sketch merging and achieves parallelism primarily across files. Rust is more deeply asynchronous within each file, while Java is parallel across files.
On TPC-DS SF1000 at 5 percent sampling, the single-node Rust implementation completes in ~3.6 seconds versus ~3.9 seconds for Java, while using significantly less CPU (7.3s vs 41.7s total CPU time) and memory (~0.8 GB vs ~9.5 GB), along with improved effective I/O throughput.
The difference is not marginal. While wall-clock time is similar, the Rust implementation achieves this with significantly lower CPU usage and memory consumption, along with more efficient I/O behavior. Under sustained load or concurrent query execution, these differences become decisive.
Based on these results, the Rust implementation was selected for the production path, as it provides significantly better resource efficiency under the same latency constraints.
Comments